
 A Bloody Borders Update
After my initial post on The Bloody Borders Project, a4g and other commenters suggested that I develop maps to illustrate the density of Muslim population as well as the terrorist attacks.
Since then I’ve been working on the Umma Maps, based on Muslim population data supplied by answers.com. The results are represented in the series of maps shown below.
All Islamic terror attacks since September 11, 2001
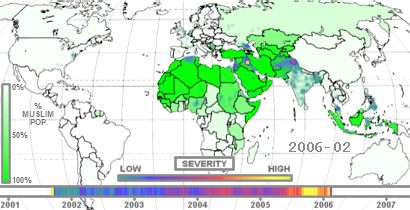
The nature of the “bloody border” is astonishingly clear in this map. With the exceptions of Iraq and Afghanistan, the highest concentrations of terrorist attacks occur along the edges of the Umma, where it meets the areas of lower (but significant) Muslim population.
And now compare this map:
Islamic terror attacks in 2002
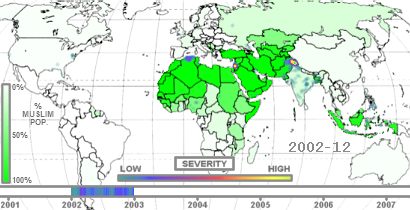
With this map:
Islamic terror attacks in 2005
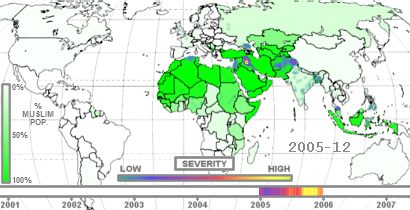
You can see that the Coalition interventions in Iraq and Afghanistan have, from a systemic point of view, caused the border of the Umma to involute, to form fractal boundaries extending into what had been the heart of Islam.
It’s not just the American troops that bring this about — the arrival of new ideas and new political systems brings its own instability and generates the “bloody border” response. The political and social concepts introduced by the Coalition into the Umma are an extreme violation of fundamentalist Islamic tenets. Thus the hardcore zealots of the Umma are drawn in to oppose the introduction of what they see as dangerous and deadly memes.
Once again, the exceptions are interesting. China, Burma, Turkey, and the former Soviet republics in Central Asia seem to be exempt from the “bloody borders” principle.
The relative calm and Burma, China and the “Stans” may have one or more of these causes:
1. Repressive dictatorial governments that maintain a monopoly on violence, or
2. Official control of information flow so that news of attacks is lacking.
Turkey is a different matter. Has its military helped to keep a lid on Islamism? Has it exported its worst troublemakers to the Muslim ghettos of Eurabia? Commenters are invited to weigh in on this topic.
In fact, the relative calm in the center of the Umma may result more from the repressive nature of the governments of Islamic countries than in a peaceful utopian political culture based on the Shari’ah. The events in Iraq suggest that the different sects and subgroups of Islam would, if given the chance, have at each other until the last throat was cut.
In any case, Samuel Huntington was not making it up: there is a border and it is bloody. The border has lately become a fractal, and the unfolding events of the next few years should prove interesting indeed.

See the complete range of maps and information, including a new (smaller) animation, at The Bloody Borders Project.
A full table of information on Muslim populations is listed below.
Note: I am well aware that the differential regional breakdown of Muslim populations within countries, especially India, Russia, and China, is significant. I have in hand a database of Muslim population statistics within Indian states, but have not had time to utilize it yet in order to make a map.
If anybody can point me to reliable and complete data (i.e., every administrative district in the country must have a separate statistic) for other countries, please put the URL in the comments or send me an email, and I will collect data to use in future updates.
Data Source for Muslim Population Statistics
| Country | Population | % Mus. |
Muslim Population |
| Afghanistan | 29,928,987 | 99.0 | 29,629,697 |
| Albania | 3,563,112 | 70.0 | 2,494,178 |
| Algeria | 32,531,853 | 99.0 | 32,206,534 |
| Angola | 11,190,786 | 1.0 | 111,907 |
| Argentina | 39,537,943 | 1.5 | 593,069 |
| Armenia | 2,982,904 | 2.0 | 59,658 |
| Australia | 20,090,437 | 1.5 | 301,356 |
| Austria | 8,184,691 | 4.7 | 384,680 |
| Azerbaijan | 7,911,974 | 93.4 | 7,389,783 |
| Bahrain | 688,345 | 85.0 | 585,093 |
| Bangladesh | 144,319,628 | 88.0 | 127,001,272 |
| Belarus | 10,300,483 | 0.5 | 51,502 |
| Belgium | 10,364,388 | 3.5 | 362,753 |
| Belize | 279,457 | 1.0 | 2,794 |
| Benin | 7,460,025 | 20.0 | 1,492,005 |
| Bhutan | 2,232,291 | 1.0 | 22,322 |
| Bosnia and Herzegovina | 4,025,476 | 40.0 | 1,610,190 |
| Botswana | 1,640,115 | 1.0 | 16,401 |
| Brunei | 372,361 | 67.0 | 249,481 |
| Bulgaria | 7,450,349 | 12.2 | 908,942 |
| Burkina Faso | 13,925,313 | 55.0 | 7,658,922 |
| Burundi | 6,370,609 | 10.0 | 637,060 |
| Cambodia | 13,607,069 | 3.5 | 476,247 |
| Cameroon | 16,380,005 | 20.0 | 3,276,001 |
| Canada | 32,805,041 | 2.0 | 656,100 |
| Central African Republic | 3,799,897 | 15.0 | 569,984 |
| Chad | 9,826,419 | 54.0 | 5,306,266 |
| China | 1,306,313,812 | 3.0 | 39,189,414 |
| Comoros | 671,247 | 99.0 | 664,534 |
| Congo (Brazzaville) | 3,039,126 | 2.0 | 60,782 |
| Congo (Kinshasa) | 60,085,004 | 10.0 | 6,008,500 |
| Côte d’Ivoire | 17,298,040 | 38.6 | 6,677,043 |
| Croatia | 4,495,904 | 1.3 | 58,446 |
| Cyprus | 780,133 | 18.0 | 140,423 |
| Denmark | 5,432,335 | 3.0 | 162,970 |
| Djibouti | 476,703 | 99.0 | 471,935 |
| East Timor | 1,040,880 | 4.0 | 41,635 |
| Egypt | 77,505,756 | 91.0 | 70,530,237 |
| Eritrea | 4,561,599 | 50.0 | 2,280,799 |
| Estonia | 1,332,893 | 0.8 | 10,000 |
| Ethiopia | 73,053,286 | 47.5 | 34,700,310 |
| Fiji | 893,354 | 7.0 | 62,534 |
| France | 60,656,178 | 7.5 | 4,549,213 |
| Gabon | 1,389,201 | 1.0 | 13,892 |
| Gambia | 1,593,256 | 90.0 | 1,433,930 |
| Georgia | 4,677,401 | 9.9 | 463,062 |
| Germany | 82,431,390 | 3.7 | 3,049,961 |
| Ghana | 21,029,853 | 16.0 | 3,364,776 |
| Greece | 10,668,354 | 2.8 | 300,000 |
| Guinea | 9,467,866 | 85.0 | 8,047,686 |
| Guinea-Bissau | 1,416,027 | 38.0 | 538,090 |
| Guyana | 765,283 | 10.0 | 76,528 |
| Hungary | 10,006,835 | 0.6 | 60,041 |
| India | 1,028,610,388 | 13.4 | 138,188,726 |
| Indonesia | 241,973,879 | 88.2 | 213,469,356 |
| Iran | 68,017,860 | 99.0 | 67,337,681 |
| Iraq | 26,074,906 | 97.0 | 25,292,658 |
| Ireland | 4,015,676 | 0.5 | 19,676 |
| Israel | 6,276,883 | 14.6 | 916,424 |
| Italy | 58,103,033 | 1.7 | 987,751 |
| Jordan | 5,759,732 | 95.0 | 5,471,745 |
| Kazakhstan | 15,185,844 | 47.0 | 7,137,346 |
| Kenya | 33,829,590 | 7.0 | 2,368,071 |
| Kuwait | 2,335,648 | 85.0 | 1,985,300 |
| Kyrgyzstan | 5,146,281 | 80.0 | 4,117,024 |
| Laos | 6,217,141 | 1.0 | 62,171 |
| Lebanon | 3,826,018 | 70.0 | 2,678,212 |
| Lesotho | 1,867,035 | 2.0 | 37,340 |
| Liberia | 3,482,211 | 20.0 | 696,442 |
| Libya | 5,765,563 | 97.0 | 5,592,596 |
| Lithuania | 3,596,617 | 0.6 | 21,579 |
| Luxembourg | 468,571 | 2.0 | 9,371 |
| Macedonia | 2,045,262 | 30.0 | 613,578 |
| Madagascar | 18,040,341 | 7.0 | 1,262,823 |
| Malawi | 12,158,924 | 20.0 | 2,431,784 |
| Malaysia | 23,953,136 | 60.4 | 14,467,694 |
| Maldives | 349,106 | 99.9 | 348,756 |
| Mali | 12,291,529 | 90.0 | 11,062,376 |
| Mauritania | 3,086,859 | 99.9 | 3,083,772 |
| Mauritius | 1,230,602 | 16.6 | 204,279 |
| Mongolia | 2,791,272 | 4.0 | 111,650 |
| Morocco | 32,725,847 | 98.7 | 32,300,410 |
| Mozambique | 19,406,703 | 20.0 | 3,881,340 |
| Myanmar | 42,909,464 | 4.0 | 1,716,378 |
| Namibia | 2,030,692 | 3.0 | 60,920 |
| Nepal | 27,676,547 | 4.2 | 1,162,414 |
| Netherlands | 16,407,491 | 6.0 | 984,449 |
| Niger | 11,665,937 | 90.0 | 10,499,343 |
| Nigeria | 128,771,988 | 50.0 | 64,385,994 |
| Norway | 4,593,041 | 1.6 | 73,488 |
| Oman | 3,001,583 | 99.0 | 2,971,567 |
| Pakistan | 162,419,946 | 96.3 | 156,491,617 |
| Palestinian Territories | 3,761,904 | 84.0 | 3,159,999 |
| Philippines | 87,857,473 | 5.0 | 4,392,873 |
| Portugal | 10,566,212 | 0.3 | 36,981 |
| Qatar | 863,051 | 95.0 | 819,898 |
| Russia | 143,420,309 | 15.0 | 21,513,046 |
| Rwanda | 8,440,820 | 4.6 | 388,277 |
| Saudi Arabia | 26,417,599 | 100.0 | 26,417,599 |
| Senegal | 11,126,832 | 94.0 | 10,459,222 |
| Serbia and Montenegro | 10,829,175 | 21.0 | 2,274,126 |
| Seychelles | 81,188 | 1.1 | 894 |
| Sierra Leone | 6,017,643 | 60.0 | 3,610,585 |
| Singapore | 4,425,720 | 16.0 | 708,115 |
| Slovenia | 2,011,070 | 2.5 | 50,276 |
| Somalia | 8,591,629 | 100.0 | 8,591,629 |
| Somaliland | 7,591,629 | 100.0 | 7,591,629 |
| South Africa | 44,344,136 | 1.5 | 665,162 |
| Spain | 40,341,462 | 2.5 | 1,008,536 |
| Sri Lanka | 20,064,776 | 7.0 | 1,404,534 |
| Sudan | 40,187,486 | 65.0 | 26,121,865 |
| Suriname | 438,144 | 22.0 | 96,391 |
| Swaziland | 1,173,900 | 1.0 | 11,739 |
| Sweden | 9,001,774 | 4.0 | 360,070 |
| Switzerland | 7,489,370 | 4.4 | 329,532 |
| Syria | 18,448,752 | 88.0 | 16,234,901 |
| Taiwan | 22,894,384 | 0.7 | 160,260 |
| Tajikistan | 7,163,506 | 95.0 | 6,805,330 |
| Tanzania | 36,766,356 | 35.0 | 12,868,224 |
| Thailand | 65,444,371 | 5.0 | 3,272,218 |
| Togo | 5,681,519 | 13.7 | 778,368 |
| Trinidad and Tobago | 1,088,644 | 6.0 | 65,318 |
| Tunisia | 10,074,951 | 99.0 | 9,974,201 |
| Turkey | 69,660,559 | 99.0 | 68,963,953 |
| Turkmenistan | 4,952,081 | 89.0 | 4,407,352 |
| Uganda | 27,269,482 | 15.0 | 4,090,422 |
| Ukraine | 47,425,336 | 0.5 | 237,126 |
| United Arab Emirates | 2,563,212 | 76.0 | 1,948,041 |
| United Kingdom | 60,441,457 | 2.7 | 1,631,919 |
| United States | 295,734,134 | 1.4 | 4,140,277 |
| Uzbekistan | 26,851,195 | 89.0 | 23,897,563 |
| Venezuela | 25,375,281 | 0.5 | 126,876 |
| Vietnam | 83,535,576 | 0.8 | 710,052 |
| Western Sahara | 273,008 | 99.8 | 272,461 |
| Yemen | 20,727,063 | 99.0 | 20,519,792 |
| Zambia | 11,261,795 | 1.1 | 123,879 |
| Zimbabwe | 12,746,990 | 1.0 | 127,469 |
| Other | 784,410,076 | 0.1 | 892,881 |
| All Countries | 6,386,793,850 | 23.4 |
1,493,776,900 |
|
Note: Some figures are estimates, and Muslim population figures are unavailable for some countries. |
|||
|
Source: http://www.answers.com/topic/islam-by-country |
|||
There is no question that your hard work is not only bearing fruit, but also producing new growth that will yield yet other fruits in the future. You have started something that may become a veritable institution.
I also want to give you a quirky little factoid, of sorts.
His name escapes me at the moment, but in the 1980s, a young hot shot in artificial intelligence research from Stanford, got an appointment at a university in Texas to work on developing software that would emulate human intelligence. I believe the acronym for the project was CYC, and it may still be going.
Several years ago, there was a documentary updating his progress. At that point, he had constructed these incredibly complex maps of network connections making up the “brain” of CYC. One objective was to feed this “brain” lots of information in order to find patterns of knowledge that would support further learning.
He pointed out that one peculiar finding was that the “brain” came back with an observation that no Muslim organizations made up U.N. associated NGOs (non-governmental organizations). That did not seem quite right because there are groups like the Green Cross. But, on reflection, that observation may be largely true. Anyway, the researcher noted it as an odd one that he would look into. This was long before 9-11.
This may be another “fractal” to consider. Not one of violence, but of social service. The Muslim equivalent of Catholic Relief, or Save the Children, or Oxfam would be found, if at all, to be functioning largely within its own sphere (presumably in part because of suspicious funding activities) and not doing much outreach into Christian and other communities.
Baron,
Perhaps a few teams of U.S. SF trainers, some weapons and air support could assist the persecuted Christians of southern Sudan in forming their own commonwealth. That would take a nice chunk from the middle of that green blob.
As a former Geography undergraduate (many moons ago, B.C., before computers) I greatly appreciate your emphasis on maps and other graphics. You might become the Mackinder of the 21st century . Bravo!
These maps are so interesting. Nice work. I notice that the terror attacks in Israel seem to have greatly diminished from year to year. At least your maps show fewer attacks there each year.
I think you got the 2 numbers at the bottom switched…
Now I just feel guilty.
Bravo, Baron!
Funny how the data seem to so closely correspond with the Islamophobe’s fever dream. Almost like all that irrational fear might be… rational.
Going to go over to Bloody Borders to see if you’ve posted larger versions of the maps for examination. 1600 x 1200 resolution makes these things like postage stamps.
Mr. Sadowski —
You’re right — I had my two variable names switched in the program code. Thanks for letting me know; I’ve fixed them in both places.
a4g —
You just love being the squeaky wheel, don’t you?
FYI, the next addition to the project will be large-scale maps. But it may take a while.
Baron,
As always, your hard work is right on target. I can’t help but see the “Pakistan” problem. You know what makes it worse, they just banned my side blog. How cool is that?
Exceptional!
Curious . . .not being familiar with Portugal’s history, how is it that it has the smallest % ?
Congratulations, Baron, on having created a fundamental Situational Awareness tool.
Baron,
Your hard and diligent work is greatly appreciated. It sure makes things much clearer.
Thanks for all you do regarding this issue.
Hope you and yours have a great weekend.
Darfur and Southern Sudan are under-reported of course, that would add in a thick solid blue band around S and W Sudan.
Indonesia is also underrepresented in that while it has less terrorists, but more government terror in the east of that country (Papua, Ambon).
Power to the bloggers!
Involution now!
Baron,
Many thanks for the excellent cartography work. A question, does the bloody borders project have any mechanism for tracking piracy?
Thanks again,
Adam
fieldpro —
That’s an interesting idea. Piracy is a distinct problem, and is certainly not confined to Muslims. I’m not sure where statistics for such things are collected.
Going into piracy is a commercial decision, and arises whenever brutal and unscrupulous people are given the opportunity. Hence the Somali pirates.
Baron, you didnt take into account estimated 24 million illegal Bangladeshi immigrants in India!
Vikrant —
I take into account whatever is in the statistics!
I have to scrape my data from somewhere, but I don’t mind revising my source. If you have an idea for a better set of statistics, I’ll be glad to look at it.
It just has to be consistent; i.e. the 24 million that are counted in India have to be NOT counted in Bangladesh.
I do have a database of Indian population totals; eventually I’ll map the Indian states and India will display more than one color of green.